Best Performing Mutual Funds of September 2020

September has been a notorious months for the financial markets.

It did get a bit turbulent! But the ride got so good later that investors have probably forgotten about the turbulence. Here’s a reminder…

NIFTY 50 saw a sharp downturn in the second last week of September. It fell from about 11,600 to about 10,800 in about one week.

The US flagship equity index S&P 500 also tumbled in the first 23 days in September.

Read: Should you invest in US equity mutual funds?

So yes, September wasn’t a quiet month. But things around quickly for global equity markets. NIFTY 50 is at 11,900+ and S&P 500 3500+ at the time of writing this.

But that doesn’t mean that we are at the beginning of a secular uptrend in the global equity markets. In fact, we’re far from it. Why?

Read: The Alpha Investor – September Issue

In The Alpha Investor – September Issue, we cover all the aspects that are likely to affect equity returns over the next few months. These are covid cases, second wave and progress on covid vaccine, US presidential elections, credit spreads and market valuations. It’s a fascinating read!

Let’s see how the headline indices moved before moving on to the best performing mutual funds of September 2020.

Large caps didn’t have the best month but mid and small cap investors would be reasonably happy.

Best Performing Large Cap Funds of September 2020

Best Performing Mid Cap Funds of September 2020

Best Performing Small Cap Funds of September 2020

Best Performing Multi Cap Funds of September 2020

Recently, a new guideline was issued by SEBI regarding multi cap mutual funds. Basically, SEBI has asked multi cap funds to invest at least 25% of their AUMs in each of large caps, mid caps and small caps. Total investments in the multi cap category top Rs. 1.4 lakh crore!

Read the full story here: SEBI Multicap Guideline: What should investors do?

Best Performing Large and Mid Cap Funds of September 2020

Best Performing Focused Funds of September 2020

Best Performing ELSS (tax-saving) Mutual Funds of September 2020

SEBI Guideline on Multicap Funds: What should investors do?

It seems the dust on the newest SEBI guideline on Multicap Funds has settled. This offers a good opportunity to review related incidences and chart out the likely scenarios.

In this blog, we’ll see…

  • SEBI’s Multicap Funds guideline and other statements made by SEBI
  • What’s the benchmark index of multicap mutual funds
  • How the fund houses have reacted?
  • What are the likely outcomes?
  • Most importantly, what should mutual fund investors do?

Read: Best Multicap Funds to Invest in 2020

SEBI’s Multicap Funds guideline

SEBI shocked the fund management, advisor and the investor community with their multicap funds guideline on 11th September.

Here are the most important lines in the guideline…

SEBI 11th September Multicap Circular

SEBI’s argument for putting out the guideline? Multicap funds are not being ‘true to label.’ Here’s a clarification they put out on 13th September…

SEBI 13th September Multicap Circular

SEBI is basically saying that multicap funds should have meaningful exposure to large, mid and small cap companies. If that’s not the case, then multicap funds are not truly multicap.

While this may make sense to some, it is a contradiction to the most common perception of multicap funds.

For as long as one can remember, multicap funds have been funds where the fund managers are given a free hand.

The fund managements are not mandated to stick to a particular style (like growth or value) or have a particular market cap bias (like large cap or mid cap). Rather, it is expected that the fund management can or cannot have any bias as per the its best judgment. A free hand.

This is the understanding the advisor and investor community have had while choosing to recommend and invest in multicap mutual funds for quite some time now.

What’s the benchmark Index of Multicap Funds

Second argument against the guideline is very easy. One only needs to know what’s the benchmark index of most multicap funds. It is the NIFTY 500 index.

To recall, the biggest 100 stocks (as per free float market cap) are large caps, next 150 (101-250) are mid caps and the remaining ones are small caps.

So, NIFTY 500 is composed of NIFTY 100 (large caps), NIFTY Midcap 150 (mid caps) and NIFTY Smallcap 250 (small caps) indices. But in the ratio of total free float market capitalization is the more interesting aspect.

  • NIFTY 100 – 77%
  • NIFTY Midcap 150 – 13%
  • NIFTY Smallcap 250 – 10%

As you can see, NIFTY 100 or large caps takes up the lion’s share of the total free float market capitalization of the NSE.

This is just how the market caps are. Large caps are way larger than mid and small caps.

If a multicap fund decides to be ‘true to label,’ it need not have 25% allocation each in mid and small caps. 13% and 10% allocations would be more appropriate.

How the fund houses have reacted

Let’s first see what options SEBI has given to the fund houses…

SEBI has said that the multicap funds don’t have just one way out by rebalancing their portfolios. But can pursue other ways like merging or converting the multicap funds if they so desire.

It’s important to note ‘Sources Say.’ This is because it’s not publicly available what proposals AMFI has made to SEBI on the matter. But we expect them to be similar to what you see above.

AMFI doesn’t want unnecessary market anxiety and volatility. 2020 has not been the best year for equity mutual fund investors and the anxiety and volatility that the guideline implementation may cause is undesirable.

What are the likely outcomes?

Nothing extreme should be expected.

Even if the guideline is implemented as it is (highly unlikely) without taking into account AMFI proposals, multicap funds have ways out. These, as we saw, are recategorizing and merging with other funds. And any other innovation that they can engineer.

But it is expected that SEBI will take into account and consider at least some of the AMFI proposals.

Whatever will come out of this will not hurt investors of multicap funds significantly or at all.

SEBI chief has said AMFI proposals (which have not been publicly revealed) are being reviewed. And SEBI may tweak the guideline if the AMFI proposals make sense to SEBI. This should give investors confidence and ease their anxieties.

What should mutual fund investors do?

Just a couple of things really – not act in haste and not predict the outcome.

Within a few minutes of the guideline, many investment enthusiasts started predicting various outcomes.

A meltdown in large cap stock prices and a melt up in small cap stock prices was the most common prediction.

A popular small cap PMS manager was elated and said this guideline made great sense.

We’re definitely certain there would be many investors who made a rush for small cap stocks and mutual funds. This resulted in a sharp 5.4% gain on the first trading day after the guideline was published. But those gains have as good as vanished.

If you managed to stay calm, good job!

Many enthusiasts also sliced and diced multicap AUM data. They predicted the quanta of outflows large caps and inflows mid and small caps would experience.

This is a situation which doesn’t require prediction, rather reaction.

If you are an investor in a multicap scheme, wait for SEBI’s final version of the guideline, AMFI’s acceptance of the guideline and the particular multicap fund’s action before reacting.

If you are contemplating additional investments in multicap funds, you might want to think again. The market seems quite overvalued compared with historical valuations.

If you must invest and find the next closest fund category to multicap funds, we recommend focused mutual funds. Here’s a good read to understand how they compare to multicap funds –

Focused Mutual Funds

Best Performing Mutual Funds of August 2020

We have had many such months like August recently. And this means that equity market is likely to catch up with economic reality.

The highlight of August was the GDP report of the April-June quarter. The GDP for Q1 of FY21 saw a contraction of 23.9%!

In simple words, if India as a country earned Rs. 100 from April 2019 to June 2019, it earned Rs. 76 from April 2020 to June 2020. That’s terrible and unprecedented.

Of course, no one was expecting a growth in GDP, but the fall is worse than consensus.

Here’s how headline indices fared in the month of August 2020 –

As you can see, small and mid caps are leading the way now! This is not an Aug specific phenomenon but has been the trend for the last few months now.

Let’s see the top performers of August 2020 across mutual fund categories…

Best Large Cap Mutual Funds of August 2020

Best Mid Cap Mutual Funds of August 2020

Best Multi Cap Mutual Funds of August 2020

Best Large and Mid Cap Mutual Funds of August 2020

Best Small Cap Mutual Funds of August 2020

Best Focused Mutual Funds of August 2020

Best ELSS Mutual Funds of August 2020

As you can see, Franklin India schemes feature with the highest frequency (5) in the above tables.

Most fund houses tend to have the same fund selection criteria and research across funds. Hence, all the funds of one fund house tend to move up and down together.

In the above tables, you can see that Franklin India and Nippon India schemes have done really well in the last one month.

Hence, it is always recommended to firstly ensure you’re investing in schemes managed by different fund managers. And secondly, to ensure that you’re investing in schemes managed by different fund houses.

This helps in optimum diversification!

Stock Splits: The poster child of the 2020 tech mania?

Apple and Tesla stock splits came into effect recently.

Before we talk about the absurdity before and after the event, let’s do a stock split 101 for newbies!

Stock Split 101

If a whole cake that costs Rs. 400 is divided into 4 equal pastries, what should be the cost of each pastry?

The cost should be Rs. 100, right? (calculated as 400/4)

This is very similar to what happens in the case of stock splits.

The company announces the date on the day of stock split. And on the day, the stock splits. When the stock split takes places, the stock price is adjusted accordingly.

Let’s take the same cake-pastry example. If the stock price on the day of stock split is Rs. 400 and a 4-for-1 stock split takes effect, we will now have 4 times as many shares each priced at Rs. 100.

Stock split is really that simple!

Why split stocks anyway?

The single biggest reason for a stock split is to make it accessible to more investors.

For example – If a stock is trading at around USD 2000 (like Tesla was just before the split came into effect), there would not be many takers of the stock because of the very high price. If it is split into 5 parts, then each new split stock would trade at around USD 400.

While this is not very important in today’s world where ‘fractional shares’ is a norm, it does have a psychological impact.

Would you like to own one full share at Rs. 100 (after a Rs. 400 share has split into 4) or one full share at Rs. 400?

If you have Rs. 2000 to invest, you can have 20 shares (after the split) instead of just 5 (before the split). And the feeling of owning 20 split but full shares will be better than the feeling of owning 5 full but unsplit shares.

What does a stock split change in a company?

A stock split doesn’t change anything else apart from the number of shares and price of each share which is simply adjusted.

For example – Suppose there are 10,00,000 outstanding shares of the company that trade in the market. If the company does a 2-for-1 stock split, after the stock split takes effect there would be 20,00,000 outstanding share of the company. The price of each share would be halved (1/2) simultaneously.

Does the company’s cash flow change? No.

Does the company’s earning change? No.

Does the company’s opportunity set expand? No.

Does the company’s performance improve? No.

There is absolutely no qualitative change in the company. All that has changed is that the stock has become a bit more accessible to investors due to the split. And the total number of outstanding shares have increased.

Apple and Tesla Stock Splits

The madness began for Tesla stock price the day the stock split was announced.

Tesla announced the stock split on 11th Aug. The stock split was to take effect on 31st Aug. Tesla stock was trading at about USD 1375 on 11th Aug.

The stock split announcement threw the US markets into a frenzy. From 11th Aug to 28th Aug, the stock price went up a staggering 61%! The stock price closed at about USD 2200 on 28th Aug.

It is critical to note that in these 17 days nothing of great significance happened at Tesla. No new invention, patent, contract or a better than expected financial result – absolutely nothing remarkable!

The stock split announcement was the only driver of this unreal 61% increase in stock price in just about a dozen trading sessions.

And if you thought the madness stopped when the stock split took effect, you’re wrong!

In one trading session of 31st Aug, the stock went up a whopping 13%!

While Apple stock split frenzy was relatively subdued, it was crazy nonetheless!

Apple announced the stock split on 30th July. Apple shares were trading for about USD 385 on 30th July. The stock split was to take effect on the same day as the Tesla stock split – 31st Aug.

From 30th July to 28th Aug, the stock price went up a staggering 30%. As of 28th Aug’s close, Apple shares were trading at about USD 500.

For Apple stocks, the madness seems to have stopped after the stock split. But one can’t be sure!

What’s the cause of this madness?

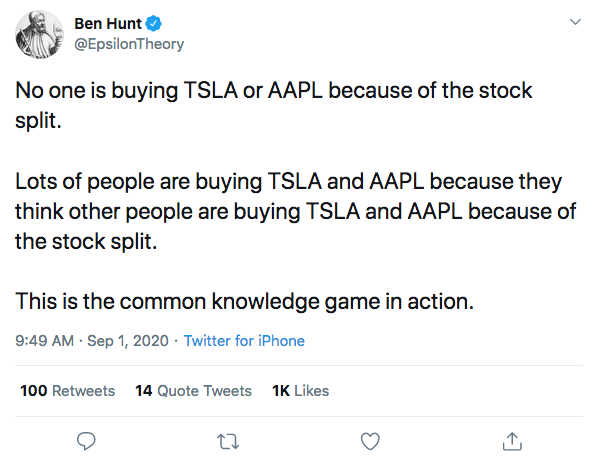
People are buying because they know other people are buying. That’s it, there’s really no other reason.

We’re in a typical bubble!

Now the one only thing we have learnt about bubbles over centuries is that bubbles pop!

It is impossible to predict when a certain bubble will pop.

One of the less rational responses to bubbles is to be a part of it (due to FOMO) and see where it takes you. This is what inflates the bubble further.

But, by far, the most rational response to a bubble is to not participate in it.

Apple and Tesla stock split events will be distinctly recalled by investors once this is over. Just as how pets.com is remembered as the poster child of the 2000 tech bubble.

India’s economic recovery has a long and tedious road ahead…

Summary – GDP and Outlook

After over 2 months of strict lock-down, India started to slowly unlock from June onwards. Relaxations were introduced gradually.

However, things slowed in July as compared to June as rising COVID-19 cases. This forced a lot of places to implement total lock-downs.

Manufacturing PMI for July slipped to 46 as compared to 47.2 in June. One step forward, two steps back!

manufacturing and servies PMI India

Even the services PMI showed only a marginal improvement of 34.2 in July as compared to 33.7 in June. We continue to remain in sharp contraction territory.

The PMI numbers are not encouraging. While the PMI in most other countries rose above 50 in July (indicating expansion), India still remains in contraction.

What’s worse is that the rate of contraction itself increased in July!

We believe that it is pertinent for authorities (central, state and local) to start seriously contemplating the economic impact of the lock-down.

In July, we witnessed a lot of places going under complete lock-down. Sporadic total lock-downs still persist and India’s biggest economic hub (MMRDA) still faces a number of restrictions.

To make things worse, we now have cases growing in hitherto unaffected parts of India. From the urban centre of Bengaluru to clusters in Eastern India.

The surge will not help in resumption of economic activity to pre-COVID levels anytime soon. The only silver lining is that the economic hub of Mumbai (and adjoining suburbs) may have peaked. However, stringent lock-down restriction still persists.

google mobility trends india

Google’s mobility trends (a proxy for activity levels) for various places/activities still at very depressed levels.

Long story short – India lags the rest of the world in economic recovery by a substantial margin.

The sombre picture of Indian Economy and its recovery (rather the lack of it) makes the price actions in Indian stock markets even more surprising and hence, even more unsustainable. While consensus estimate for GDP for FY21 is contraction of 4-5%, we believe that we are easily on track to do worse.

Given how high-frequency data is shaping up, we believe that the road to recovery will be a long and tedious one. And stock markets should catch up to this reality sooner rather than later.

Read more about our outlook for the Indian Markets in July’s issue of The Alpha Investor.

A detailed picture of the Indian Economy and its probable roadmap can be found in the following paragraphs…

Inflation and Monetary Policy

Headline inflation numbers (both CPI and WPI) were not published for the months of March and April since the necessary survey couldn’t be done. Official numbers for June have been published and CPI inched up 6.09% while WPI shrank by 1.8%.

india inflation

CPI print of 6.09% is above RBI’s target range (2-6%) and has increased concerns about inflationary pressures in months ahead. We however believe that the inflationary pressure is short-term (driven by supply chain disruption and rising energy and commodity prices) and we will soon start seeing disinflation. WPI tends to lead CPI and if we look at wholesale price inflation, we have been seeing deflation for 2 consecutive months.

The inflation narrative is fueled by following reasons:

  • Unprecedented monetary and fiscal stimulus
  • Disruption in supply chain owing to COVID-19 and trade war
  • Inflation in commodity prices seen recently

commodity index

If we look at commodities index, it is now flattening after rising sharply from its April lows. The index was up just 3.2% in July after inflating almost 40% from its April lows.

wti crude price

Even crude prices are now flattening after sharp uptick from April lows. These rates-of-change in crude and commodities and the unprecedented demand shock reinforces our belief that current inflationary pressure is likely a transitory phenomenon. Further, it is likely we will see disinflation once the transition is complete.

Exchange Rate

INR appreciated by 1% against the USD during in the month of July.

usd inr depreciation

This was likely driven by…

  • Overall global dollar weakness
  • India’s current account surplus
  • Positive net portfolio flows

Depreciating dollar has been one of the prime reasons for the bumper risk-on rally in the Indian markets.

There is a strong negative correlation of NIFTY movement with INR deprecation in the short term. Roughly at the time markets bottomed (23rd March), INR had depreciated by almost 7% before bouncing back as stock markets also rallied.

It is worthwhile to note that the INR would have likely appreciated sharply had it not been for the RBI. India’s current account went into surplus in Q4FY20 for the first time in 10 years. This was driven by fall in oil prices and subdued oil demand (due to lock-down). Coupled with huge portfolio flows, this would have put immense pressure on Rupee to appreciate.

However, RBI has consistently intervened in the Forex market to keep Rupee from appreciating. This is evidenced in RBI’s massive build-up of Forex reserve over the past few months.

To read more about how the month of July was for Indian and Global Economy and Markets, read July’s issue of The Alpha Investor here.

Equity Market Wrap Up – July 2020

Are we in a dot.com bubble again? Or is it something else?

We’re definitely not in a dot.com bubble again just because tech stocks are rallying. Recall that during the dot.com bubble the mere prospect of internet/technology was being bet upon. Prospect, not earnings.

Today, the tech stocks are rallying because this is the only sector that is seeing any earnings growth. We’re talking about Apple, Amazon, Google, Microsoft, Nvidia, Netflix, Tesla and Reliance. These are behemoths, near monopolies in their niches today. They are also the ones generate revenue and earnings growth. So, it is natural that they be valued more than they were last year. But how much more?

The answer apparently is that no price is too high for these stocks. Their prices know only one direction – up!

This happened in the early 1970s as well. An informal and infamous American bluechip index ‘Nifty Fifty’ was treated like FAANGMAN is being treated today. Read about the Nifty Fifty and what happened in the Alpha Investor July Issue.

Read – The Alpha Investor – July Issue | Cover Story: History doesn’t repeat, but it often rhymes

Indian Equity Market Indices – July 2020

Here’s a look at how major Indian Equity Market Indices performed in July…

Indian markets continued to rally in July despite no significant improvement in the economy.

As of 31st July, NIFTY was down just 9% from its January high and was up a staggering 45.5% from its March bottom. Even the mid and small cap stocks continued their stellar run in July.

As you can see, IT and Pharma were the best performing sectors during the month rallying by 22.5% and 11.65% respectively. Banks and FMCG sectors were the underperformers during the month.

It may come as a surprise that the small caps index has been the best performing index of 2020 ahead of large and mid caps. It is, however, important to note that before the covid induced crash small and mid caps were struggling. Large cap index, on the other hand, was at an all time high in Jan 2020.

India Equity Market Valuation – July 2020

The recovery has been so quick that NIFTY 50 index has gone from fairly attractive valuations to very high valuations in a few months’ time.

NIFTY PE is at all an all time high. 30.2 as of 31st July and 31.3 as of 11th August.

Read – How does the NIFTY PE affect mutual fund returns?

The PE ratio of midcaps has shot up. This can be attributed to loss-making midcap firms who are negatively contributing to the earnings.

A slightly more accurate picture can be provided by the PE ratio of NIFTY Midcap Liquid 15 index (consisting of the 15 most liquid midcap stocks). It is close to the historical average.

Mid caps and small caps feel fairly valued currently. But given the sky high valuation of large caps, a correction looks highly likely. This correction would invariably affect the mid and small caps as well. So, while it may feel like a good time to invest in mid and small caps, a better time will come if large caps correct.

Read – Best performing mutual funds of July 2020

Best Performing Mutual Funds of July 2020

The stock market movements have become curious these days.

Most people wonder if the stock market really reflects the economic reality any more. Mutual fund investors too are confused with the wild movements in stock markets they have observed in the last few months.

A number of investors believe that we are in the build up of a 2000 type tech bubble. For people who aren’t aware of the 2000 tech bubble, it was the time when a company would add a ‘.com’ to its name and its stock price and valuation would become 10x if not more!

In the late 1990s, the internet was new and investors grossly overestimated the value internet would add to a company’s valuation. Investors put in money like they would in a sure shot lottery in any tech/internet related stock they could find!

However, it was realized that while internet will profoundly change the world, stock prices had more than captured this. This resulted in the bursting of the tech bubble and it is one of the most popular story about stock markets and asset price bubbles today.

Read here – The Dot-com Bubble of 2000

Coming back to the question – Are we in a tech bubble today? Unlikely!

We’re more likely in a Nifty Fifty kind of situation today! Not the Indian Nifty 50 index but the infamous American stock market index of the 1970s – Nifty Fifty.

We draw parallels between today’s tech mania and the the 1970s Nifty Fifty bubble in July’s issue of The Alpha Investor.

Read here – The Alpha Investor – July Issue | Cover Story: History doesn’t repeat, but it often rhymes!

Let’s see how the headline indices did for the month of July 2020 –

Best Large Cap Mutual Funds of July 2020

Best Mid Cap Mutual Funds of July 2020

best mid cap funds july 2020

Best Small Cap Mutual Funds of July 2020

Best Multi Cap Mutual Funds of July 2020

best multicap funds july 2020

Best Large and Mid Cap Mutual Funds of July 2020

best large and mid cap fund july 2020

Best Focused Mutual Funds of 2020

best focused funds july 2020

Best ELSS Funds of 2020

best elss funds july 2020

Equity Market Wrap Up – May 2020

The topic of disconnect between the stock markets and real economy is back.

And it is back at a time when the disconnect is probably the widest!

In the USA, millions have lost livelihoods and covid-19 hasn’t exactly slowed down but guess what? NASDAQ is up on the year and S&P 500 has erased all it’s 2020 losses!

Here at home, although the market recovery has been less dramatic. But the disconnect is still observable – new covid-19 cases are peaking every day and the economy hasn’t opened up completely. In the midst of all this, since 23rd March, NIFTY 50 has gained a staggering 32%!

You can read more in our monthly newsletter The Alpha Investor: May Issue

Let’s now see how the equity markets were placed by the end of May…

Equity Market Indices

As you can see, May wasn’t a particularly exciting month for equities overall. Except for NIFTY Auto Index and NIFTY Pharma Index, most other indices had a usual month.

Pharma is the only index that’s up on the year. Not just up but up by 21%! FMCG is close to erasing its 2020 losses. All other sectoral indices are still deeply negative – especially Financials. Despite the broad market recovery since late March, Financial Index is down by 40% on the year!

Interestingly, we see mid and small caps lose less than large caps in May. A sign that the rally has broadened. Let’s see if this trend sustains.

We don’t see signs of the market recovery in the above table because it started on 24th March! To read more about the market recovery that’s taking place and who is leading it, read: Large cap, mid cap or small cap: Who leads the market recovery?

Equity Market Valuations

Valuation-wise, NIFTY 50 is slightly overvalued on paper but massively overvalued if covid-19 impact on earnings is taken into account. Let’s see how…

As you can see, the NIFTY 50 TTM PE is close to 1 standard deviation above the historical average. But this ignores the impact of the lockdown due to covid-19.

In fact, earnings are expected to fall 20% or more! This means, at the current prices, the PE is actually close to 29!

29 was the NIFTY 50 PE when this market crash began. So, valuation-wise, we have already recovered. Of course, this is putting it quite simply but it is not completely wrong.

Midcap PE is still below the historical average. Again, it looks attractive on paper but the negative earnings growth needs to be taken into account.

Smallcaps look the most attractive of all!

Best Performing NIFTY 50 Stocks of May 2020

The discord between equity markets and economy is probably the widest ever.

We discuss this disconnect in finer details in The Alpha Investor: May Issue.

Read more: The Alpha Investor: May Issue | Cover Story: The Great Disconnect

To give you a peek of what you’ll find in there, there is not just one but three disconnects that one can observe today. They are…

  • The disconnect between the stock markets and the real economy (the most obvious one)
  • The disconnect between stocks in emerging and developed markets
  • The disconnect among stocks in different sectors

The second disconnect can be observed if you are following the US Equity Markets. US equity indices have sky-rocketed since late March. In fact, NASDAQ, one of the most followed US Equity Indices, is not only up on the year but at an all-time high!

An all-time high in the middle of a severe recession – the greatest of the disconnects!

Indian and other Emerging Equity Markets, on the other hand, have had a relatively slower recovery. See below –

Read more: Investing in US Equity Mutual Funds: Risks and Rewards

The third disconnect is also noticeable. Just see how Financial Index has progressed with respect to Pharma Index. In fact, Pharma Index has left all other indices far behind!

Read more about these disconnects in detail: The Alpha Investor: May Issue

Let’s see how various market cap based indices moved in May…

Best Performing NIFTY 50 Stocks of May 2020

Worst Performing NIFTY 50 Stocks of May 2020

Some win, some lose. Let’s see who lost the most in May 2020…

As you can see, financial stocks have taken quite a beating not just in May but in the last few months.

Disclaimer: This is a trivia post and should not be construed as investment advice. Finpeg (Neam Caps Pvt Ltd [ARN-113082]) will not be responsible for any investment decision taken based upon the above information. One must consult an independent financial advisor before taking any investment decision.

Best Performing Equity Mutual Funds of May 2020

The disconnect between equity markets and economy is probably the widest ever.

We discuss this disconnect in greater detail in The Alpha Investor: May Issue.

Read more: The Alpha Investor: May Issue | Cover Story: The Great Disconnect

To give you a flavour of what you’ll find in there, there is not just one but three disconnects that one can observe today. They are…

  • The disconnect between the stock markets and the real economy (the most obvious one)
  • The disconnect between stocks in emerging and developed markets
  • The disconnect between stocks in different sectors

The second disconnect can be observed if you are following the US Equity Markets. They have sky-rocketed since late March. In fact, NASDAQ, one of the most followed US Equity Indices, is at an all-time high! Indian and other Emerging Equity Markets, on the other hand, have not had such a dramatic recovery. See below –

Read more: Investing in US Equity Mutual Funds: Risks and Rewards

The third disconnect is also observable. Just see how Banking Index has progressed with respect to Pharma Index. In fact, Pharma Index has left every other index far behind!

Read more about these disconnects in detail: The Alpha Investor: May Issue

Let’s see how large, mid and small cap indices moved in May…

Best Performing Mutual Funds of May 2020

Best Large Cap Mutual Funds of May 2020

Best Multi Cap Mutual Funds of May 2020

Best Mid Cap Mutual Funds of May 2020

Best Large and Mid Cap Mutual Funds of May 2020

Best Small Cap Mutual Funds of May 2020

Best ELSS Mutual Funds of May 2020

Disclaimer: This is a trivia post and should not be construed as investment advice. Finpeg (Neam Caps Pvt Ltd [ARN-113082]) will not be responsible for any investment decision taken based upon the above information. One must consult an independent financial advisor before taking any investment decision.